
Debug javascript.

Guide to Debug your java script files in google Chrome.


Ways to find debug console in chrome.

2. press F12 or inspect element

Below window will open up which contains various tabs.
 
Tab Details:

Elements: it shows HTML part of your page.
console : in case you want to run some statements.
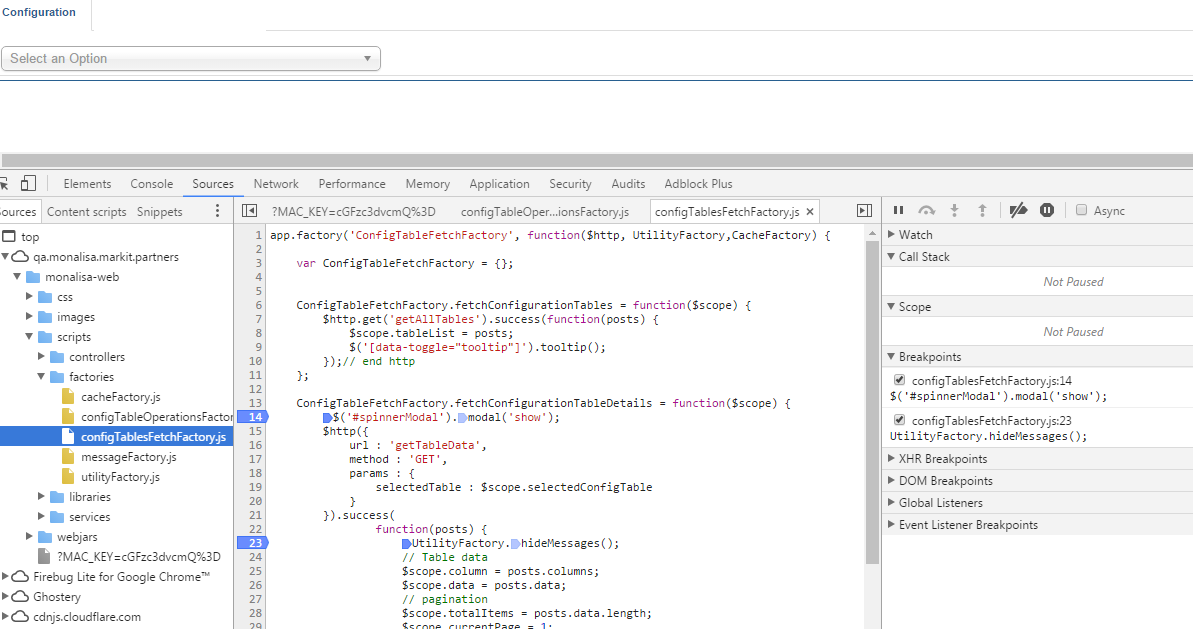
sources : all your JavaScript files.
Network : shows all your Ajax and load requests.
Performance: you can monitor your page performance
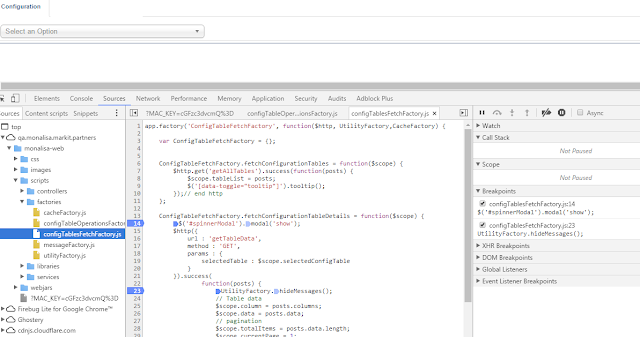

How to debug:

To debug any javascript file just search your file by using ctrl+O or select your file from the left panel of your browser window.

To add debug point just click on row number as shown in the image below.
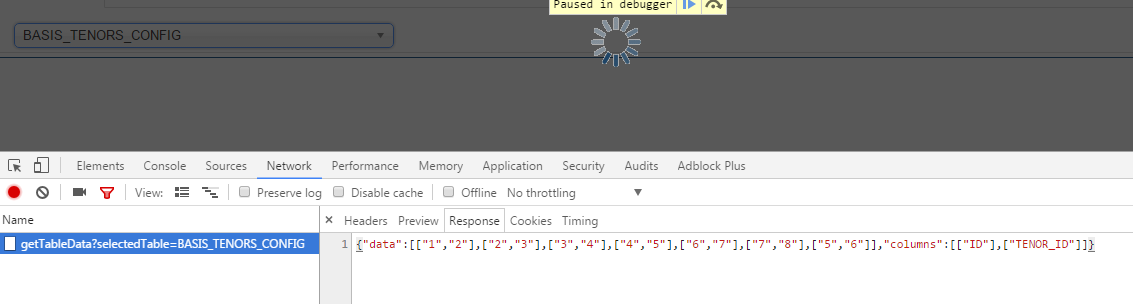

Now perform any operations on you webpage. Here I'm selecting value from the dropdown.


As soon as you select any value from the drop down. your request goes for processing and your request stop on debug point.


For this request in network tab there is an entry for it. which shows data retrieve from the request for more information you can select request header,response and preview tab.

After successful hit of the request your request will enter in the success part of your ajax request.


If you want to change and explore more values you can go to console tab.

if you want to change values of HTML element then go to element tab where you can change style of the page and can see change in real time.


Comments

Popular posts from this blog

Extent report plugin for cucumber framework

Extent Reports  are the most popular  reporting  used with Selenium. ExtentReport API makes our life easy to generate interactive  report  with simple configuartions. It supports almost all Java and .NET test frameworks such as TestNG , JUnit , NUnit etc Here we are discussing about  a plugin which is build on  Extent Report specially for Cucumber. This plugin is used to simple out the implementation of  Extent Report  in  Cucumber Framework .  We are creating a maven project to implement the integration of our plugin with cucumber 1. Create new maven project in any tool eclipse/sts/intellij 2. Open pom.xml and update below entries. Step 1 : Add Cucumber Extent Reporter library to Maven Project Add  cucumber-extentsreport <dependency>      <groupId> com.vimalselvam </groupId>      <artifactId> cucumber-extentsreport </artif...

java: You aren't using a compiler supported by lombok, so lombok will not work and has been disabled.

  In order to make projects compile with the existing builds of Lombok processor, as a workaround you can use the flag -Djps.track.ap.dependencies=false which should be added to File | Settings | Build, Execution, Deployment | Compiler | Build process VM options field. This will disable collection of dependencies specified by an annotation processor when Filer methods are called

Failure to transfer https://repo.maven.apache.org/maven2 was cached in the local repository

Error : Failure to transfer org.apache.maven.plugins:maven-surefire-plugin:pom:2.17 from https://repo.maven.apache.org/maven2 was cached in the local repository, resolution will not be reattempted until the update interval of central has elapsed or updates are forced. Original error: Could not transfer artifact org.apache.maven.plugins:maven-surefire-plugin:pom:2.17 from/to central (https://repo.maven.apache.org/maven2): The operation was cancelled. pom.xml /LogReaderServer line 1 Maven Configuration Problem Solution : Remove all your failed downloads: For windows: cd %userprofile%\.m2\repository for /r %i in (*.lastUpdated) do del %i